
Governed Power BI datasets
Semantic models over validated project data, with one definition each for percent complete, constraint free, and material ready, sliced by CWA, package, discipline, and contractor.

We build and run the reporting a capital project reads every week: governed Power BI datasets, dashboards for progress, constraints, and material readiness, published through the Project Portal in a tenant you own.
Semantic models over validated project data, with one definition each for percent complete, constraint free, and material ready, sliced by CWA, package, discipline, and contractor.
Weekly views built to the project's fixed questions: EWPs issued IFC against plan, material received by CWP, IWP aging, and actuals against the four week lookahead.
Skyline views of package status against schedule dates, from EWP through PWP, CWP, and IWP to System, and Burndown curves of work remaining, forecast by any of five models.
Reporting inventory
Sit with each audience, list what they report and to whom, and record the question each page answers.
Dataset build
Model validated project data into governed datasets, with definitions your project controls lead signs off.
Dashboard build
Build each report against live project data and review it page by page with the people who present it.
Portal rollout and handover
Publish through the Project Portal, run the first weekly cycles together, and hand the stack to your team.
Construction reporting on a well-run capital project is a weekly discipline with fixed questions. Engineering reports EWPs issued IFC against baseline and forecast. Procurement reports material received by CWP. Construction reports CWPs started on time, IWP aging, and actuals against the four week lookahead. Leading indicators sit beside them: open HOLDs with forecast release dates, documents not yet allocated to a package, data discrepancies across the MDR, the DMS, and the model. Every number traces to a package, and the weekly meeting spends its time on the work. That is the reporting we build and run.
The build starts underneath the visuals. Governed Power BI datasets sit over validated project data, so percent complete, constraint free, and material ready each carry one definition that every report inherits. Progress rolls up the way the packages do, IWP to CWP, document to EWP, with rules of credit your controls lead signs off. On top of the datasets we build the views the weekly cadence needs. Skylines read package status against schedule dates across EWP, PWP, CWP, IWP, and System views. Burndowns track work remaining, with a forecast beside the trend. Constraint, HOLD, and material readiness pages carry aging and forecast dates on every row, and when a validation check fails, the exception publishes with an owner and a closure date. Fixing what the checks find is part of the scope.
The reports live where people already look. On our projects that is the Project Portal, the front end of the common data environment, with a section for every discipline and a landing view for each audience, so leadership, planners, and the field each read the same numbers on their own page. When position matters to the question, 3D for Power BI puts the model on the report page, colored from your status fields and filtering both ways with the other visuals; an enterprise deployment at a Tier 1 EPC runs it in production today. The datasets, the reports, and the portal deploy to your Power BI tenant and stay with you when the engagement ends.
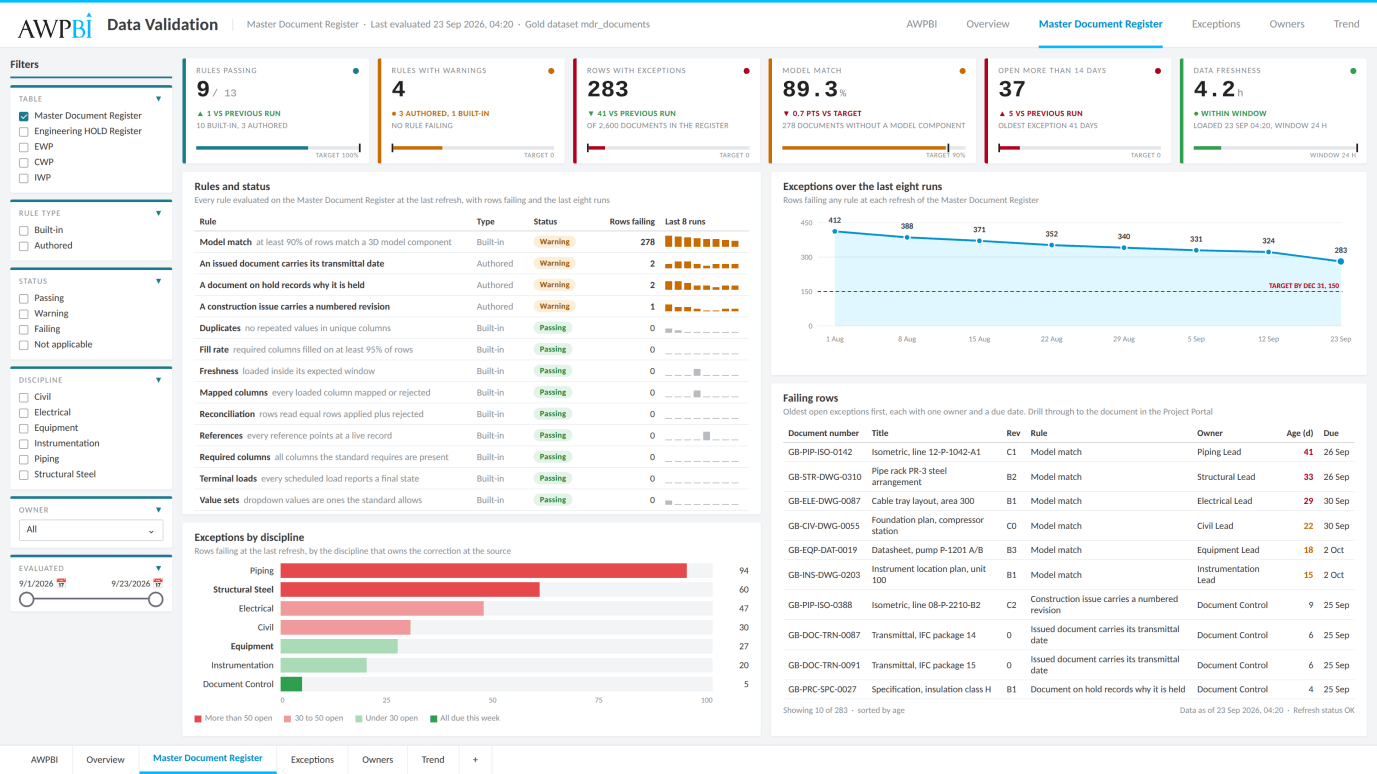 Custom DashboardsBespoke Power BI project-status dashboards, built to your data and your reporting calendar.
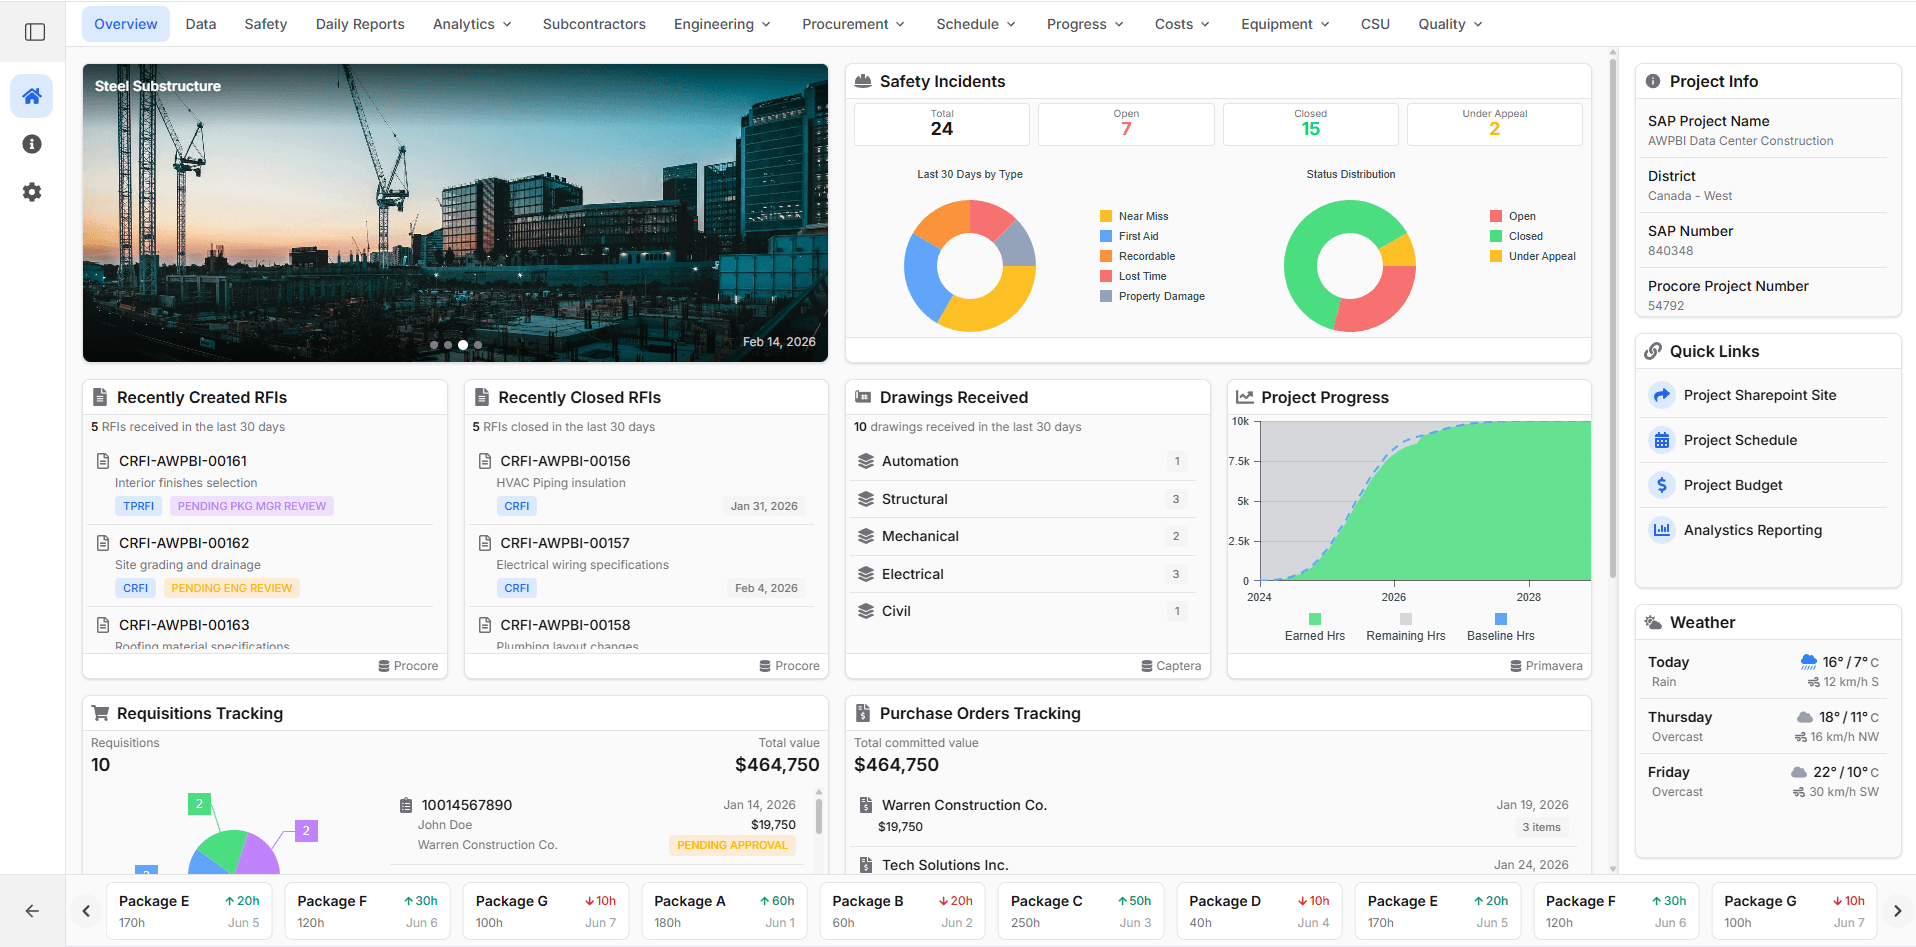 Project PortalThe front end of the common data environment, with a section for every discipline and a view for every audience.
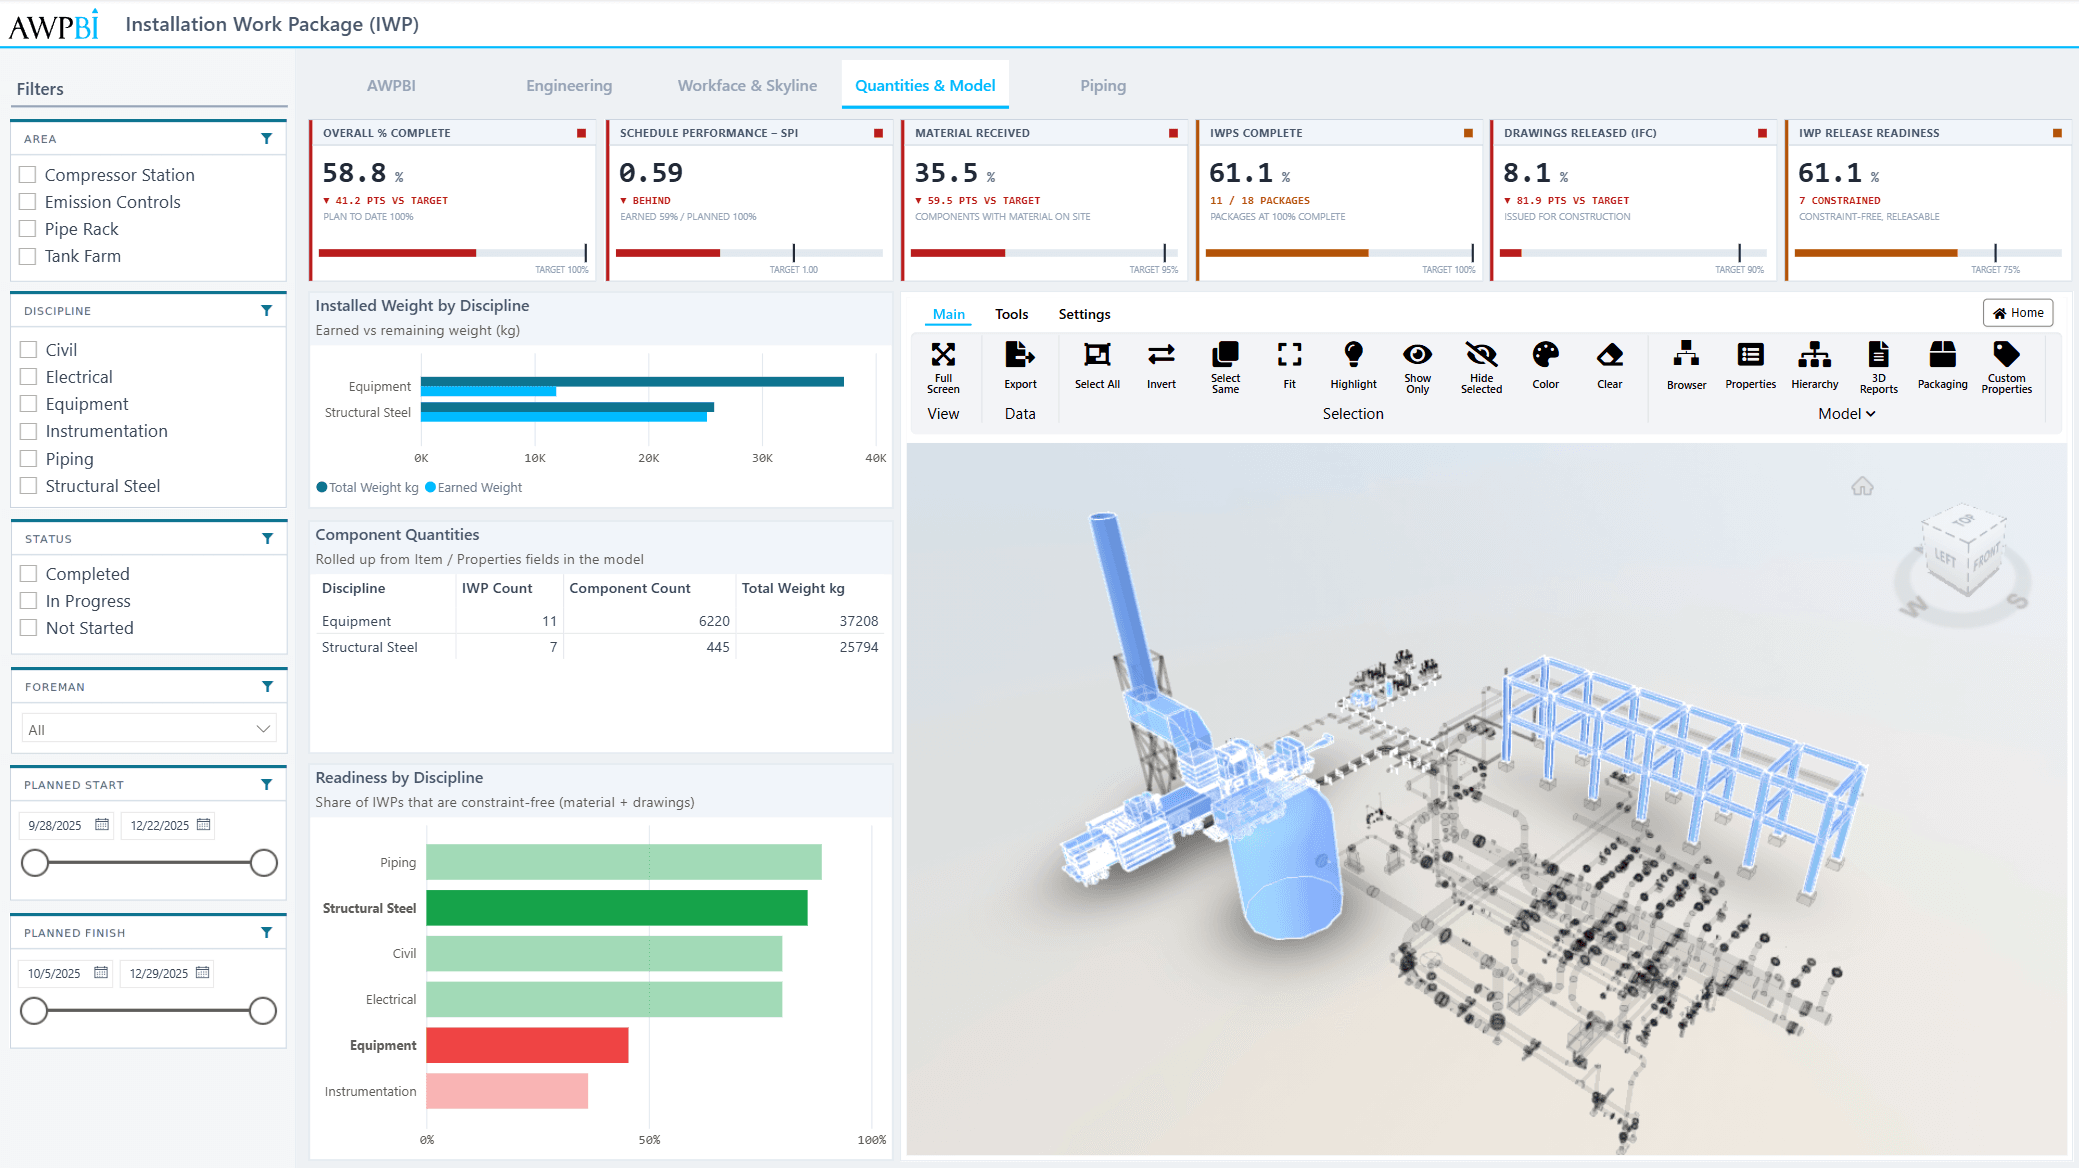 3D for Power BIA Power BI custom visual that colors the 3D model by package and material status inside the report.
We sit down with your controls and reporting leads, walk the current weekly cycle, and scope the first datasets and dashboards.