A free Power BI custom visual that links UDiTH (Universal Digital Twin Hub, by CAXperts) to your reports. Click a row or a slicer, and the UDiTH viewport selects, fits, highlights, or isolates the matching 3D objects, using your own Power BI and UDiTH data model.
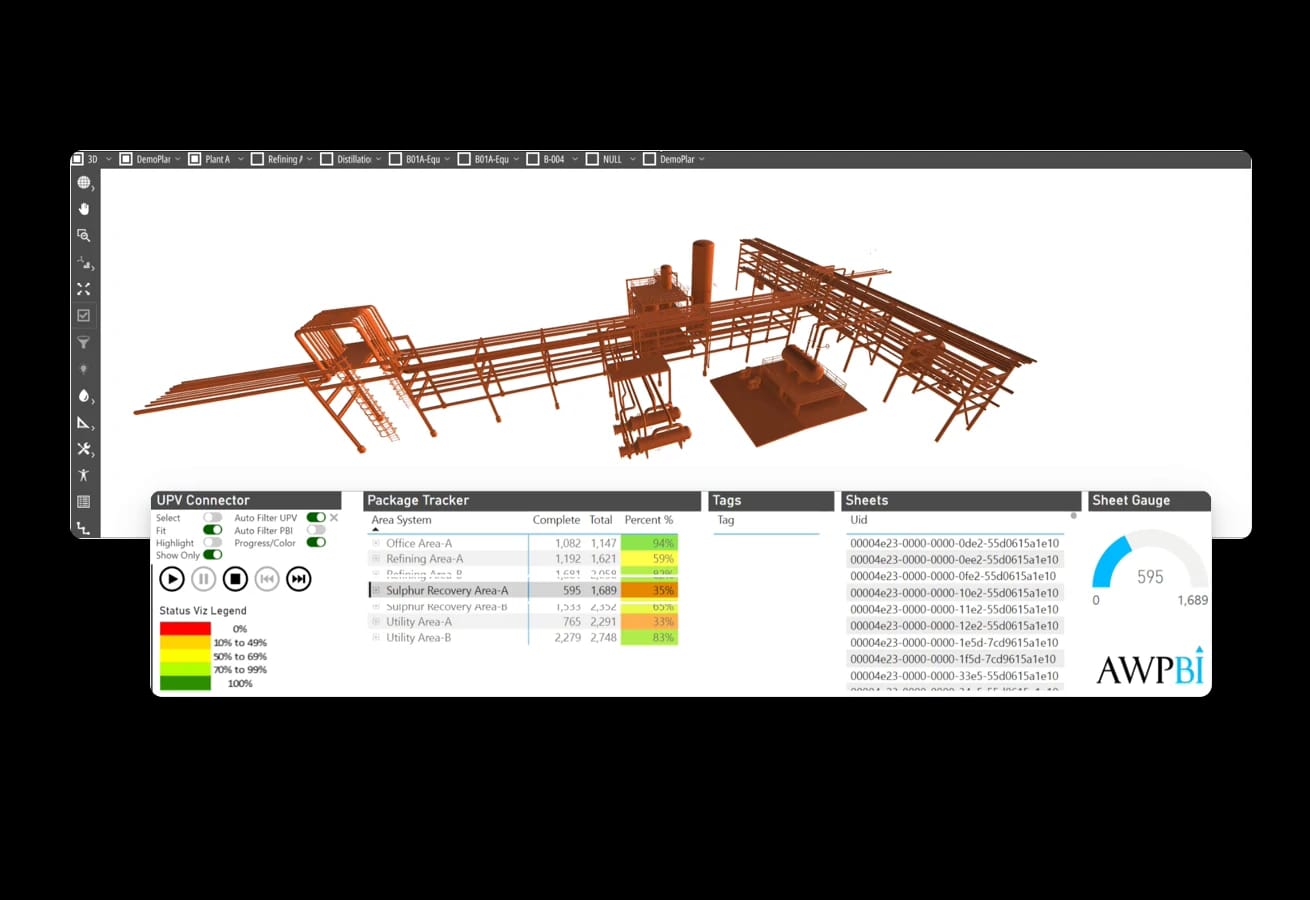
The connector is a practitioner tool, published free on Microsoft AppSource. Paid work only enters the picture if you want us to build around it.
The full visual, available on Microsoft AppSource for everyone, free of cost.
The connector filters the UDiTH viewport with real-time data from Power BI through AppControls. Select tags in a table or slicer, and UDiTH can select, fit, highlight, or show only those objects.
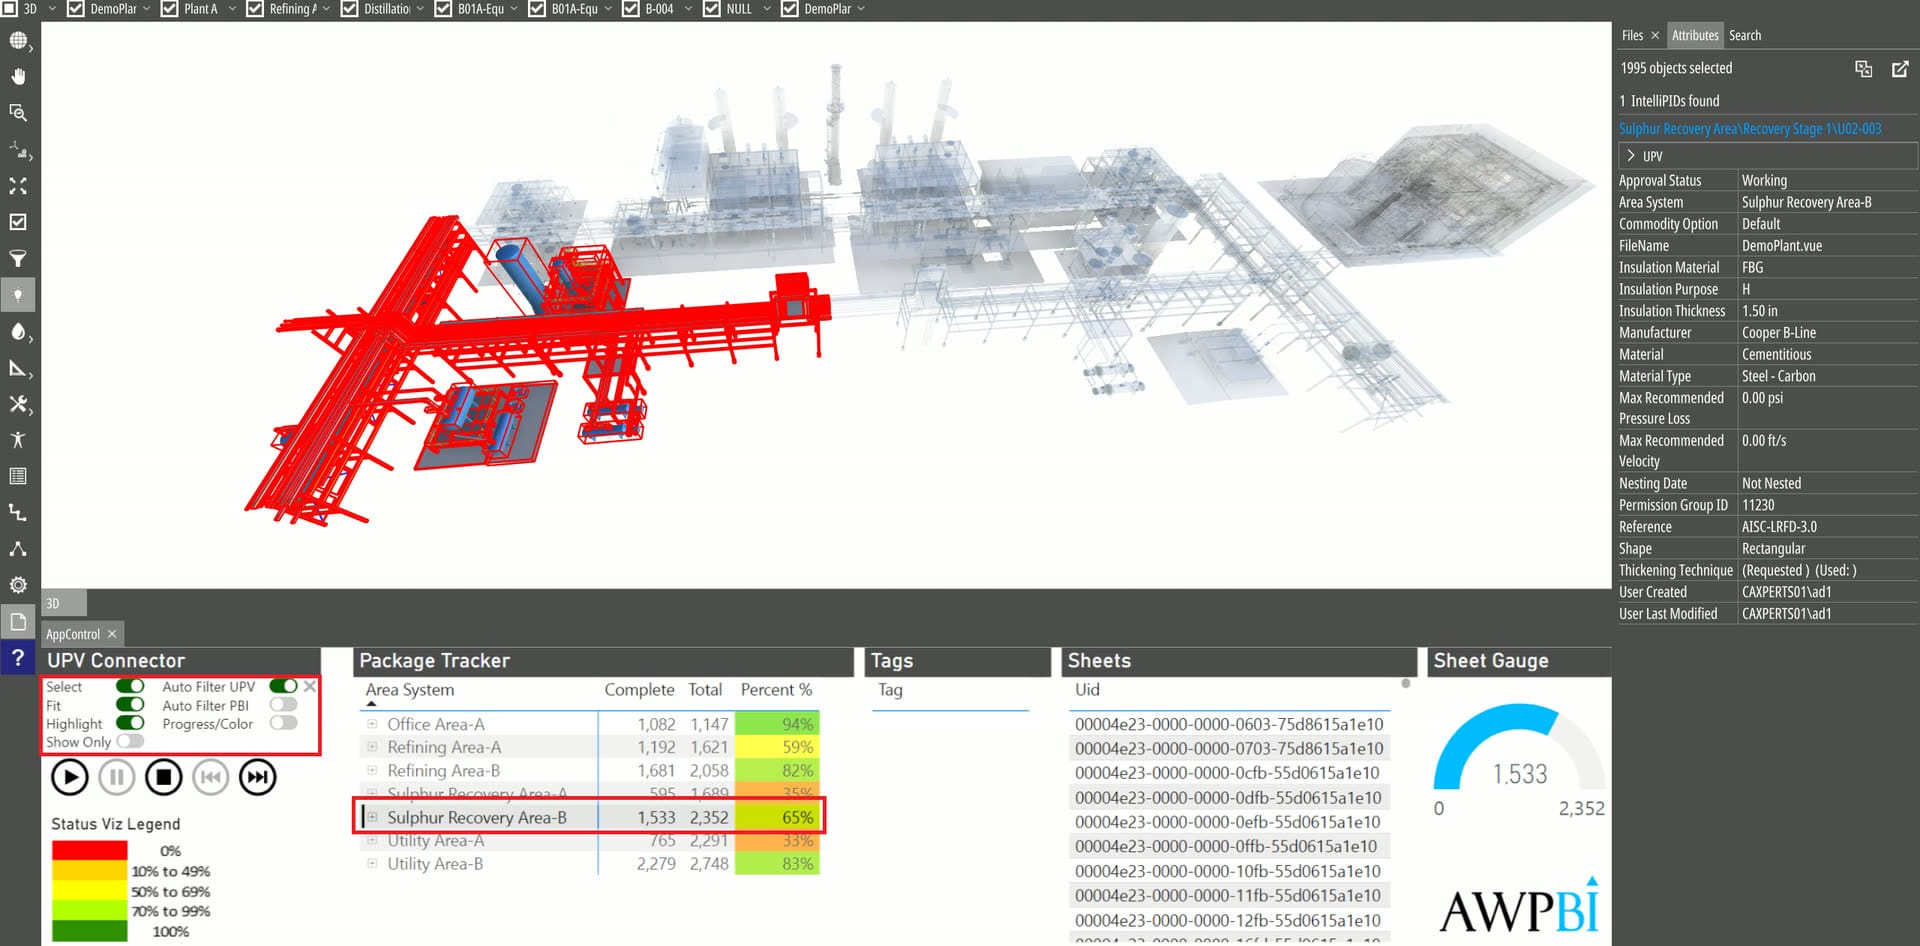
Feed the Progress/Color well and the model colors itself: a red-to-green gradient by default, or your own hex values, color names, or percent-complete figures.
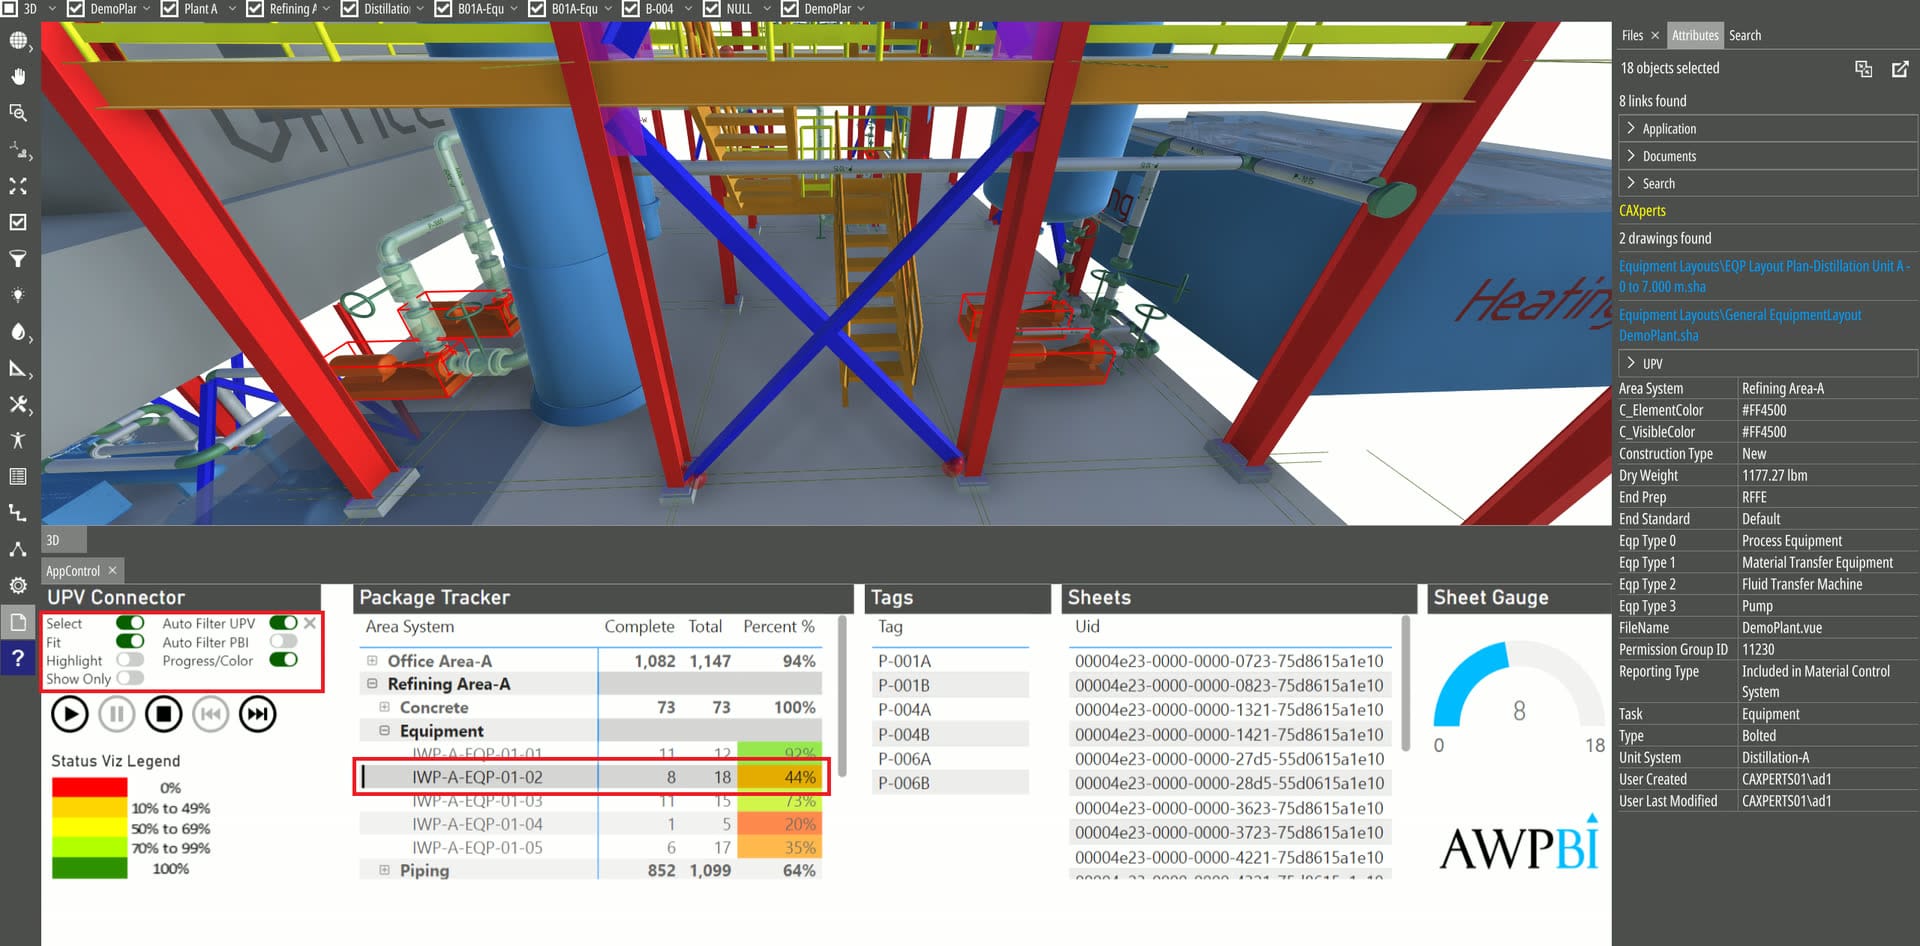
Selects 3D objects in UDiTH and returns their attribute data.
Centers and fits the selected 3D objects to your window.
Grays out unselected objects and renders them semi-transparent.
Hides every 3D object except your current selection.
Auto Filter UDiTH and Auto Filter PBI keep both sides current as you click.
Map UDiTH Attribute Name and Value to query on multiple parameters.
Default red-to-green gradient, or hex values, color names, and percentages.
Pair with the Play Axis visual to step through sequences as a simulation.
The connector creates interoperability between the plant model and the report your team already lives in.
 UDiTHThe Universal Digital Twin Hub, by CAXperts. The connector drives its viewport.
 Power BISelection and progress color flow from your Power BI report.
Common in these industries
Grab the free visual from AppSource, or talk to us about building it into your project dashboards.
