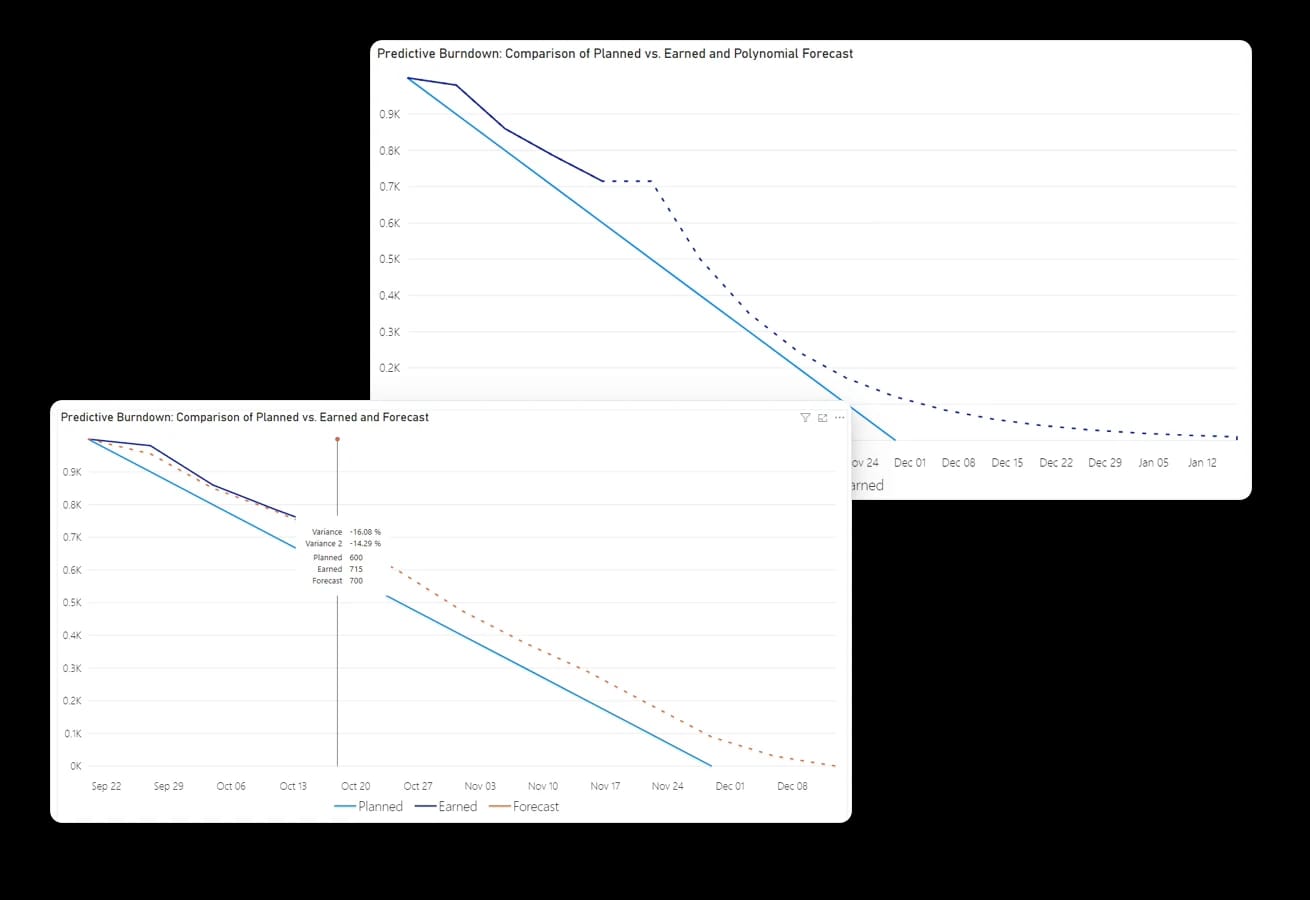
A free Power BI custom visual that plots remaining work over time: baseline, actual, and a forecast generated from your own history. Built for IWP backlogs, constraint counts, and any scope you can put in a Power BI table.
Burndown is one of our free practitioner tools. If you want the reporting around it built for you, we price the engagement.
The full visual on Microsoft AppSource. Every feature, every forecast model, no cost.
Burndown generates a forecast from your actuals using linear or polynomial regression, exponential smoothing, or moving averages, so the chart shows where the backlog is heading.
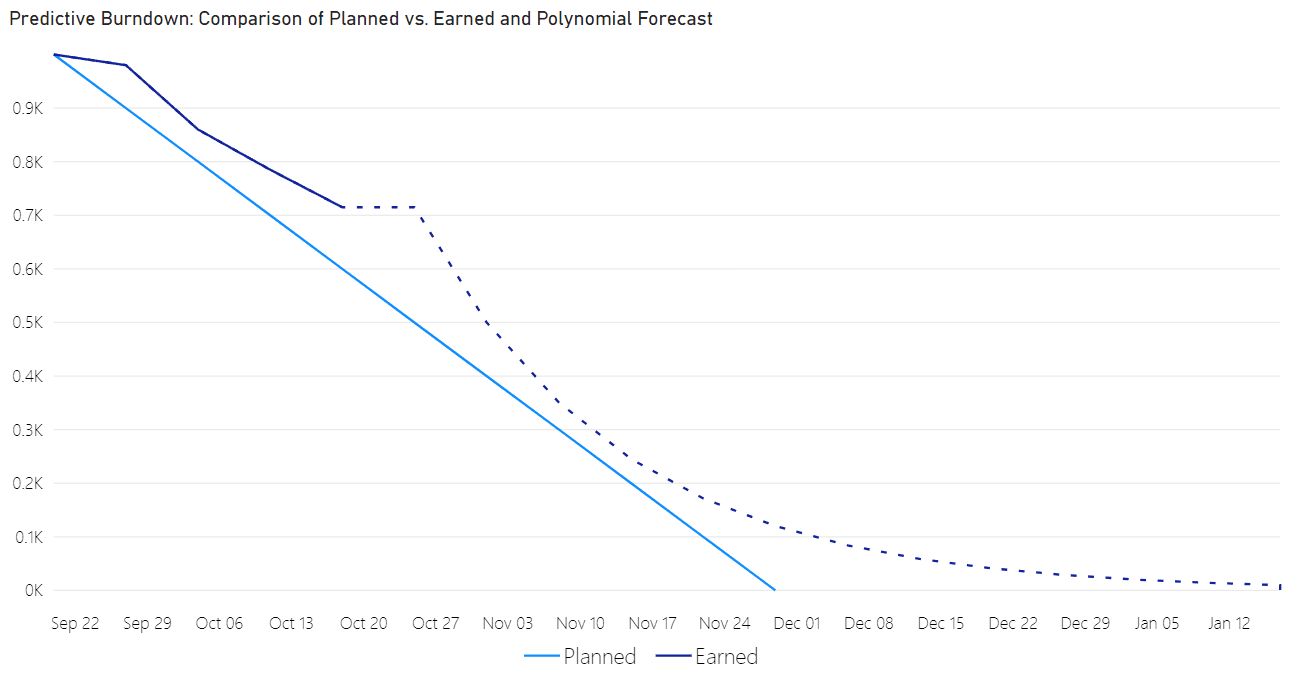
The visual plots whatever you feed it: remaining IWPs, open constraints, punch items, drawings to issue. If it lives in your Power BI model, Burndown can chart it.
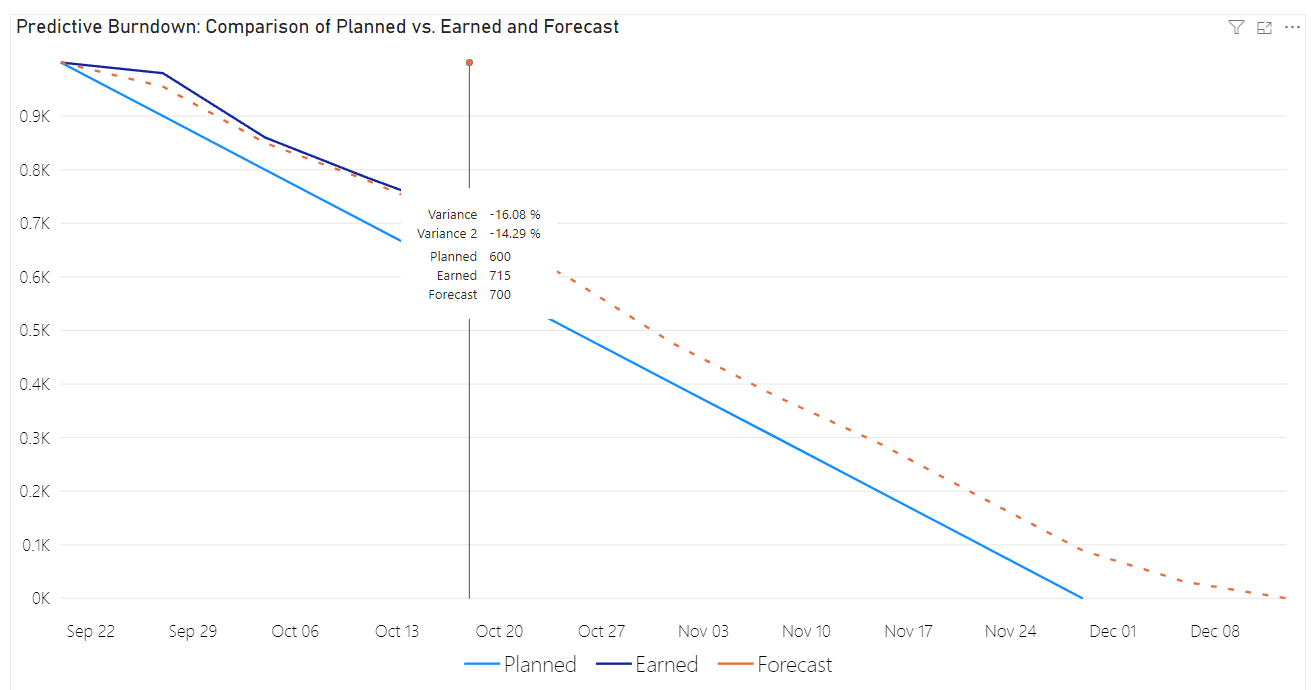
Three curves in one visual: planned work, earned work, and the projection.
The forecast is generated from your actuals; no predefined forecast column required.
Linear regression, polynomial regression, exponential smoothing, and linear or exponential moving averages with a configurable period.
Switch between per-period and cumulative views of the same data.
Hover any data point to read its details in place.
Layout, data labels, lines, legend, and axes are all configurable in the format pane.
Chart remaining IWPs, open constraints, or punch items alongside the rest of your project report.
Install from Get more visuals inside Power BI. No license, no cost.
Burndown renders whatever is in your Power BI model: remaining counts from Primavera P6 activities, Smart Materials line items, or any table you already report on.
 Power BIBurndown renders whatever is in your Power BI model.
 Primavera P6Chart remaining counts from Primavera P6 activities.
 Smart MaterialsChart remaining Smart Materials line items.
Common in these industries
Install Burndown from AppSource, or talk to us about the reporting behind it.
