The UPV Connector is a Power BI custom visual that filters the UniversalPlantViewer 3D viewport with live data from a Power BI report, and filters the report back from a selection in the viewer. It works against your own Power BI and UPV data models through AppControls.
The visual provides:
- Bidirectional filtering between the report and the UPV viewport, manually or automatically
- Viewer actions including select, fit, highlight, show only, and color
- Attribute mapping by value alone, or by a name and value pair for querying on multiple attributes
- Progress coloring from a numeric percentage on a red to green gradient, or from explicit color values
- Animation settings that pair the connector with the Play Axis visual for simple simulations
Note: UniversalPlantViewer is software developed by CAXperts GmbH. The UPV Power BI Connector is a custom visual intended solely for use alongside UPV.
Getting Started
Access
The UPV Connector is available free of cost in the Power BI marketplace. In the Visualizations pane, click the three dots and select Get more visuals, then search for UPV. Select it to view the details and click Add to bring it into your report.
Field Wells
The connector has three data wells:
- UPV Attribute Name
- UPV Attribute Value (mandatory)
- Progress / Color
Drag and drop fields into these wells to establish a connection with the model data.
Note: Field values are case-sensitive. They must be spelled exactly as the corresponding attributes are spelled in UPV.
Using UPV Attribute Value
When you supply only the UPV Attribute Value, the column dropped in that well becomes the single mapped attribute. The column name is the left side of the filter condition and its values are the right side.
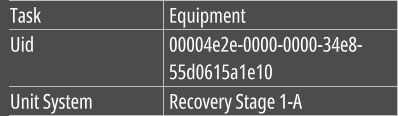
The attribute name in UPV must match the column header of the data populating the UPV Attribute Value well exactly.
Using UPV Attribute Name and UPV Attribute Value
When both wells are populated, the connector builds its queries dynamically: values from UPV Attribute Name become the left side of the condition, and values from UPV Attribute Value become the right side.
This lifts the single-attribute limit, so a report can query on multiple parameters at once.
Adding Progress or Color
The Progress / Color well drives the coloring of the model. If you enable the color action but leave the well empty, no color is applied.
When the well is populated, it accepts either of two kinds of value:
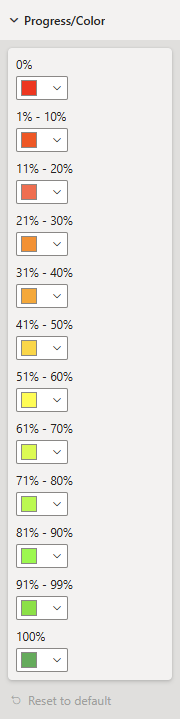
Progress values. Colors come from the settings under the Progress / Color tab of the Format visual pane. By default the connector assigns colors to exactly 0% and 100%, plus 10% increments on a gradual red to green scale. These defaults can be changed in the formatting settings.
Direct color values. A hex string such as #FF0000, or a standard color name such as blue or red.
Functionality
Filter PBI Button
Filters the Power BI report to the selected 3D objects. Select the objects in the viewer and click Filter PBI, and the report data filters to match.

Filter UPV Button
Filters the 3D viewer to the selected report items. Select rows in a Power BI table and click Filter UPV, and the viewer applies the enabled model operations to those items.

Settings Gearwheel
The gearwheel on the visual lets the end user pick which filter types apply.

The available operations are:
- Select. Selects the 3D objects and provides their attribute data.
- Fit. Centers and fits the selected 3D objects to the window.
- Highlight. Grays out all unselected 3D objects and makes them semi-transparent.
- Show Only. Hides all 3D objects except the selected ones.
- Color. Displays the color status or progress of the selected objects.
- Auto Filter UPV. Syncs the UPV model to the Power BI selection without clicking Filter UPV.
- Auto Filter PBI. Syncs the Power BI visual to the UPV model selection without clicking Filter PBI.
Formatting Options
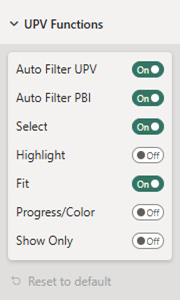
UPV Functions
Sets which UPV filter functions are enabled by default. The end user can still toggle their own preferences from the gearwheel.
Progress
Sets the automatic coloring of 3D objects from the Progress / Color well. A red to green gradient is applied by default. The values for 0% and 100% are separate values in their own right, not the ends of a range.
Button Styling
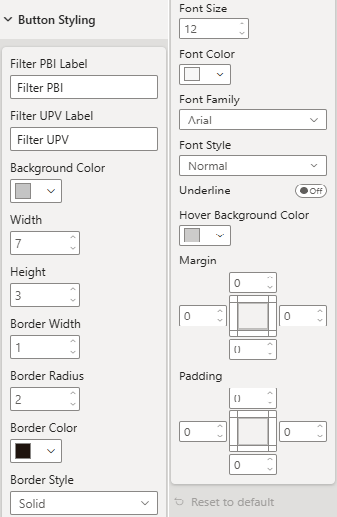
Formats the Filter PBI and Filter UPV buttons. Color, size, border, font, margin, padding, and hover color are all configurable.
Settings Wheel Styling
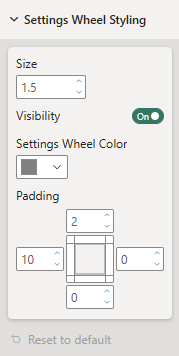
Formats the gear icon, and can turn the wheel off entirely. Turning it off removes the end user's ability to choose filter options, limiting them to whatever is enabled under UPV Functions.
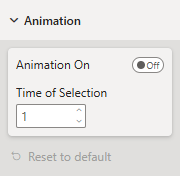
Animation Settings
Pairing the UPV Connector with the Play Axis visual produces simple simulations. Sort the simulation manually, or import dates from a schedule such as Oracle P6.
- Flashing selected objects momentarily gives a more simulated look.
- Toggle Animation on from the settings menu and set a timeout.
- Auto Filter UPV must be toggled on as well.