
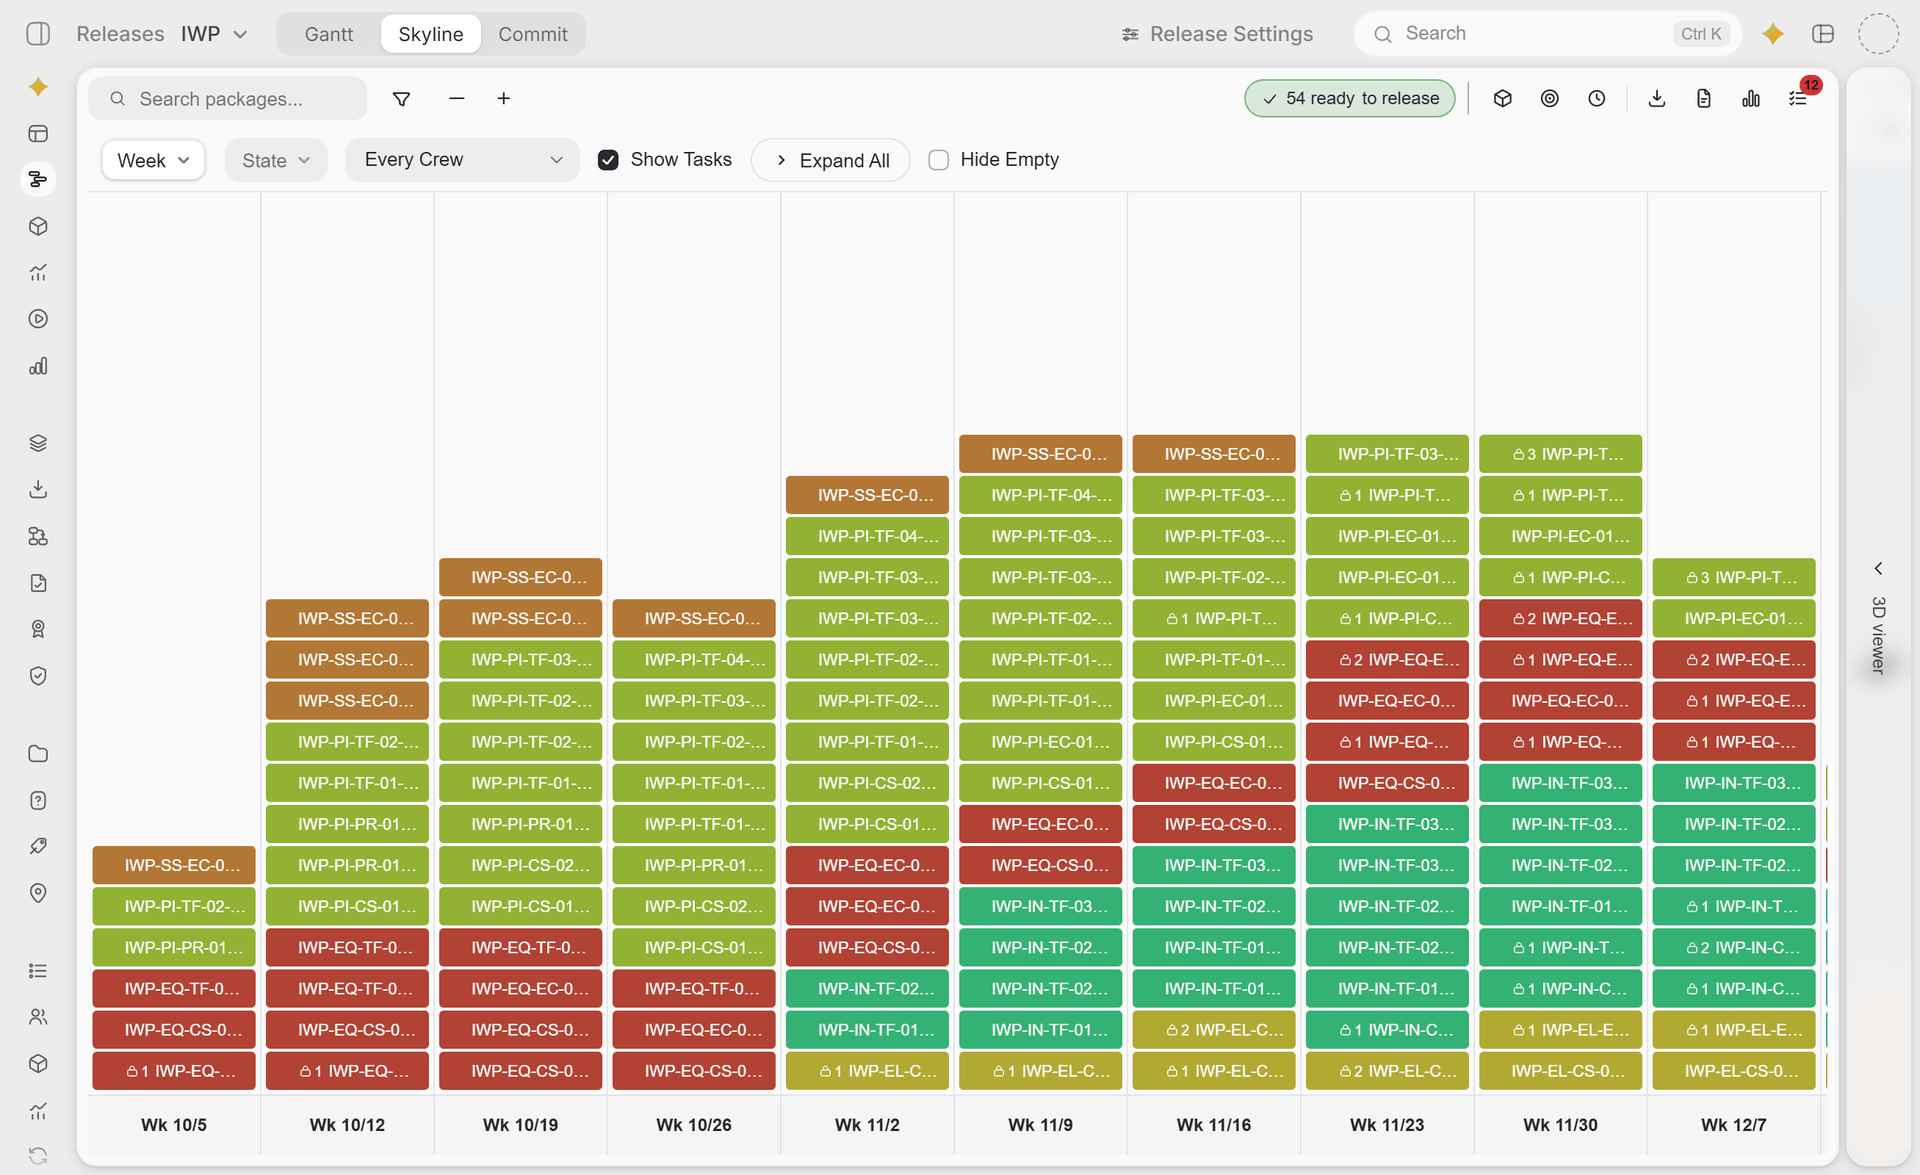
A skyline is a chart of work packages stacked by the week they are planned, with each package drawn as a card that shows its readiness and its warnings. Read left to right it shows the sequence, and read by column height it shows how much work sits in each week.
Each Card Is a Package
A card carries the package name, its state, and any warning that matters, such as an open HOLD or a material line not yet received. Cards stack into columns by planned week, and the columns can be grouped by week, by state, by discipline or by work item. The result is the lookahead drawn as a picture, and a room reads a picture faster than it reads a register export.
Backlog Depth Is Read from the Height of the Coming Weeks
For workface planning the skyline answers how many weeks of constraint-free work each discipline has ahead of it. That depth is measured against a target the project sets, and the chart marks a discipline that has fallen below it. A thin column three weeks out is a warning that engineering, vendor documents or material will not land in time for the packages planned there. IWP Aging as the Governing Metric explains why that early warning is the one that saves money.
The EWP Skyline Is Linked to the Schedule
Engineering progress is reported by EWP, as the percentage of documents issued IFC inside each package, and the skyline is the picture of that progress. The requirement that gives it teeth is the link to the Level 3 schedule. When the skyline is built from the schedule dates and the register counts together, any misalignment between the Master Document Register and the schedule shows as a bar in the wrong week, or as a package present in one source and absent from the other. Engineering HOLDs are displayed on the bar, one document per row behind it, so an EWP at 100 percent IFC with two accepted HOLDs reads differently from one with none. Equivalent skylines are maintained for VEWPs, FEWPs, PWPs and CWPs, which gives the whole value chain one chart type and one way of reading it.
Reading It in the Lookahead Meeting
The weekly meeting walks the skyline from the current week outwards. Past weeks with open cards are aging packages. The current week is the commitment. Weeks three to eight show whether placeholders, vendor documents and material are arriving in time for the packages planned there. A skyline that is honest about forecast dates, with slippage visible week over week, earns more trust than one that is always green.
Skyline, the free Power BI visual, draws five skyline types from any package register, and the same chart is built into openAWP's planning pages with backlog depth per discipline. Both read the project's own register, which stays with the client together with the software when the engagement ends. Power BI for construction reporting covers the data model behind it, and the Skyline product page has the install.